← All projects · Computer Vision · AI Engineering
Classical Computer Vision
Muhammad Hammas · AI Engineer · Master's in Artificial Intelligence
No neural networks, no training, no GPU. Fourteen of fifty-seven projects, chosen because each one's finding contradicts what the method is assumed to do. 15 projects.

Canny sensitivity
Tuning on shapes costs 19%
Show the resultOn the generated scene, 12 of the configurations score a perfect F1 of 1.000. A saturated benchmark has no power left to separate the things it is being asked to rank, so the choice among those twelve is arbitrary as far as it is concerned.
It is not arbitrary on photographs:
Identical on the benchmark, 19% apart on the real images. Pinned by
test_tuning_on_shapes_costs_nineteen_percent_on_photographsandtest_the_synthetic_scene_saturates.The synthetic scene is not worthless — it is not decisive. Across the 18 settings both grids share, the correlation between synthetic F1 and photograph F is +0.751. It orders the settings roughly right and cannot pick between the good ones, which is exactly the failure mode of a benchmark everyone has already solved.
---
Sr Scene 1 acacia and herd · edges 2% 2 alpine church · edges 14% 3 deer and fawn · edges 21% 4 bears on a hillside · edges 37% Code private Full page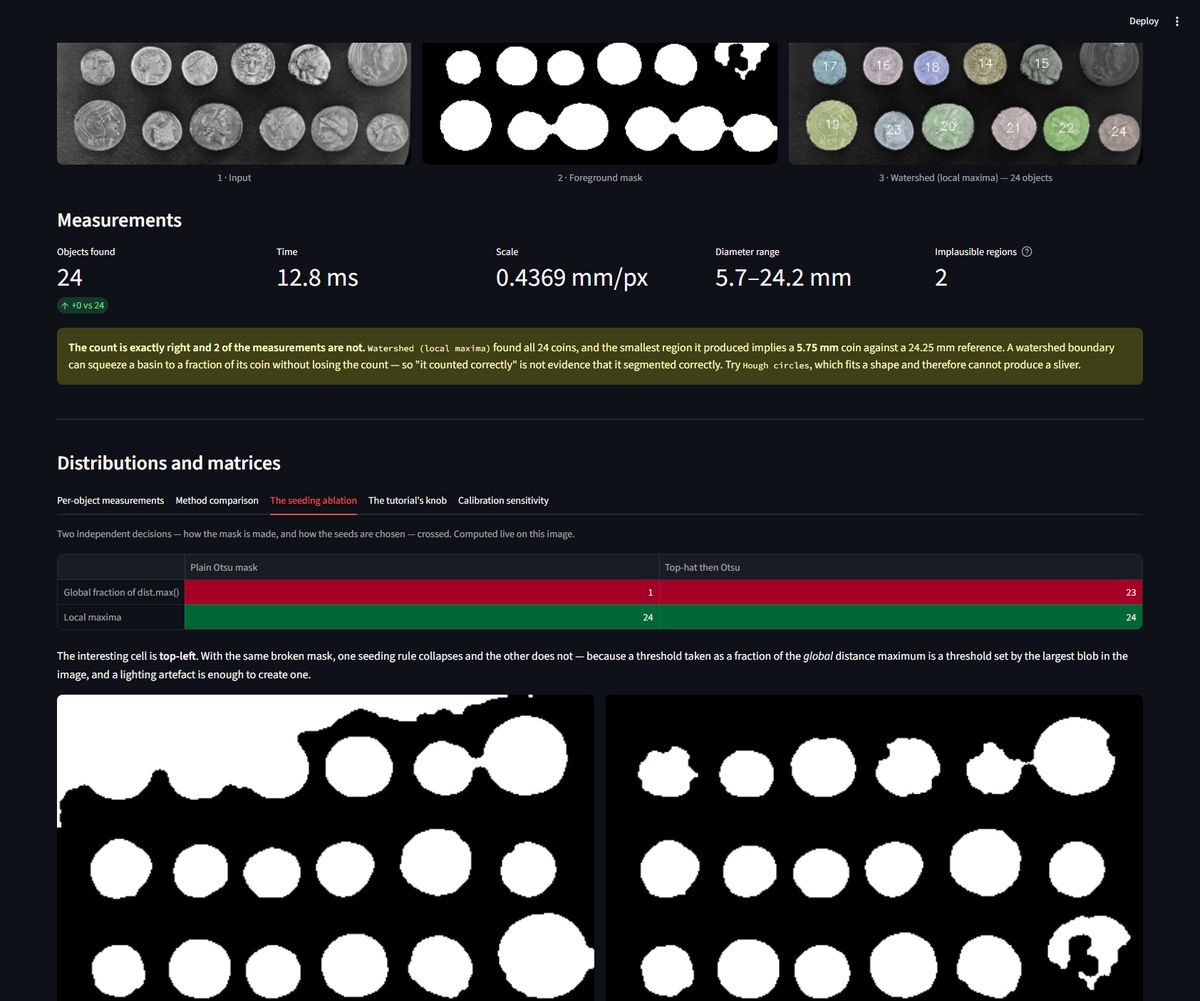
Coin counting
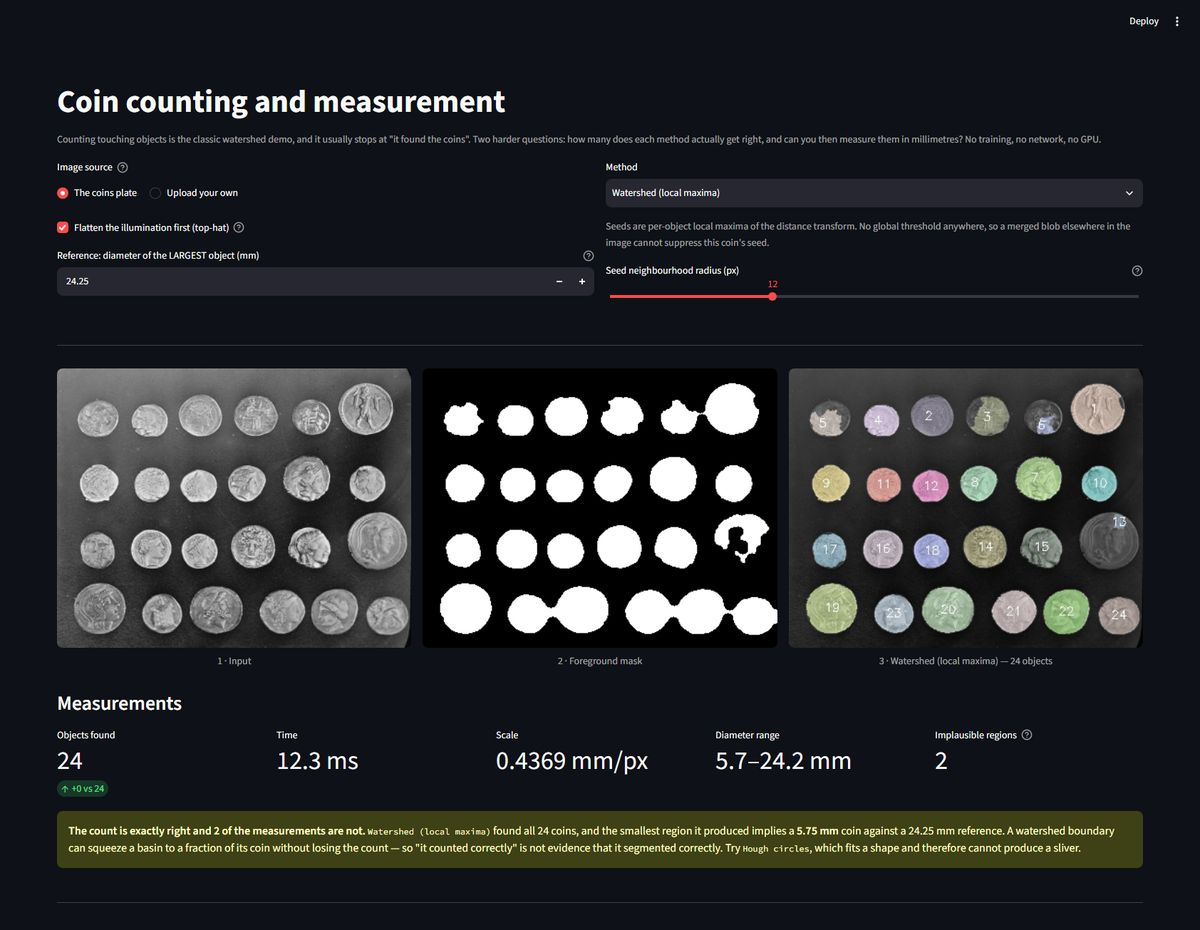
The OpenCV tutorial's seed rule (a fraction of the global distance maximum) counts 1 coin of 24 when a lighting artefact merges the mask; local-maxima seeding counts 24 of 24 on the same broken mask
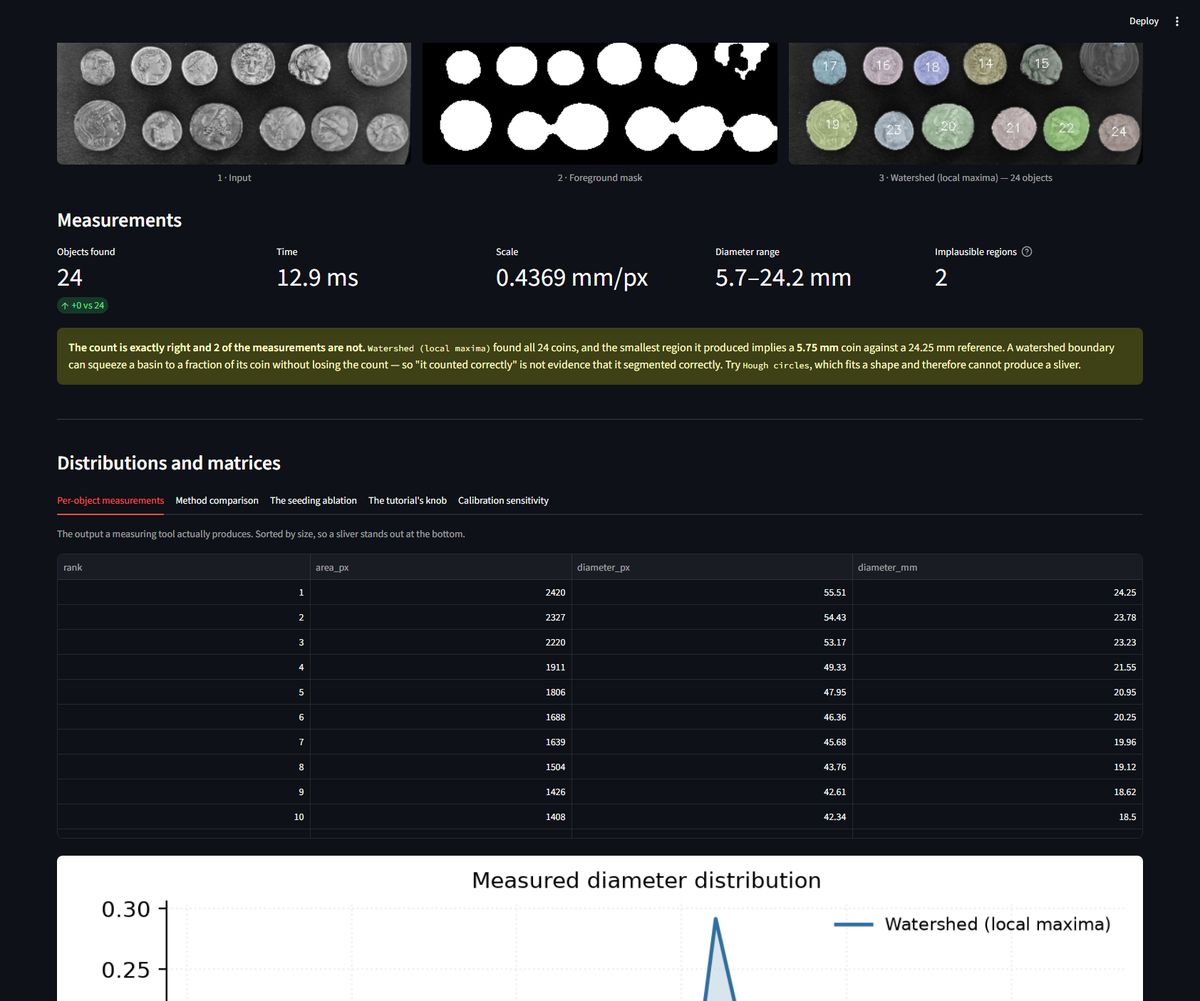
Show the resultThe OpenCV tutorial's seed rule (a fraction of the global distance maximum) counts 1 coin of 24 when a lighting artefact merges the mask; local-maxima seeding counts 24 of 24 on the same broken mask. And three methods count 24 while only one measures them plausibly — watershed's smallest basin implies a 5.75 mm coin next to a 24.25 mm reference
Sr Scene 1 green felt · spread out 2 green felt · coins touching 3 green felt · side-lit 4 white paper · coins darker than the table 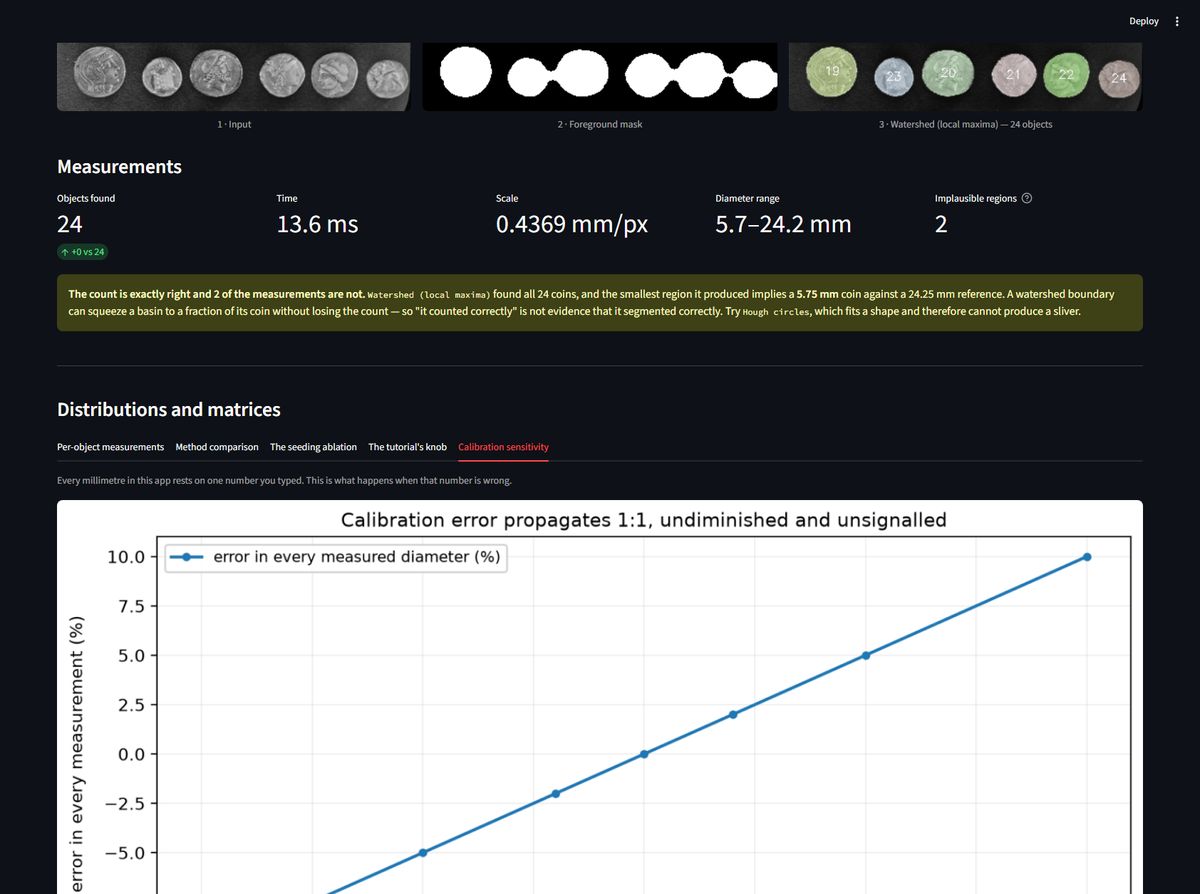
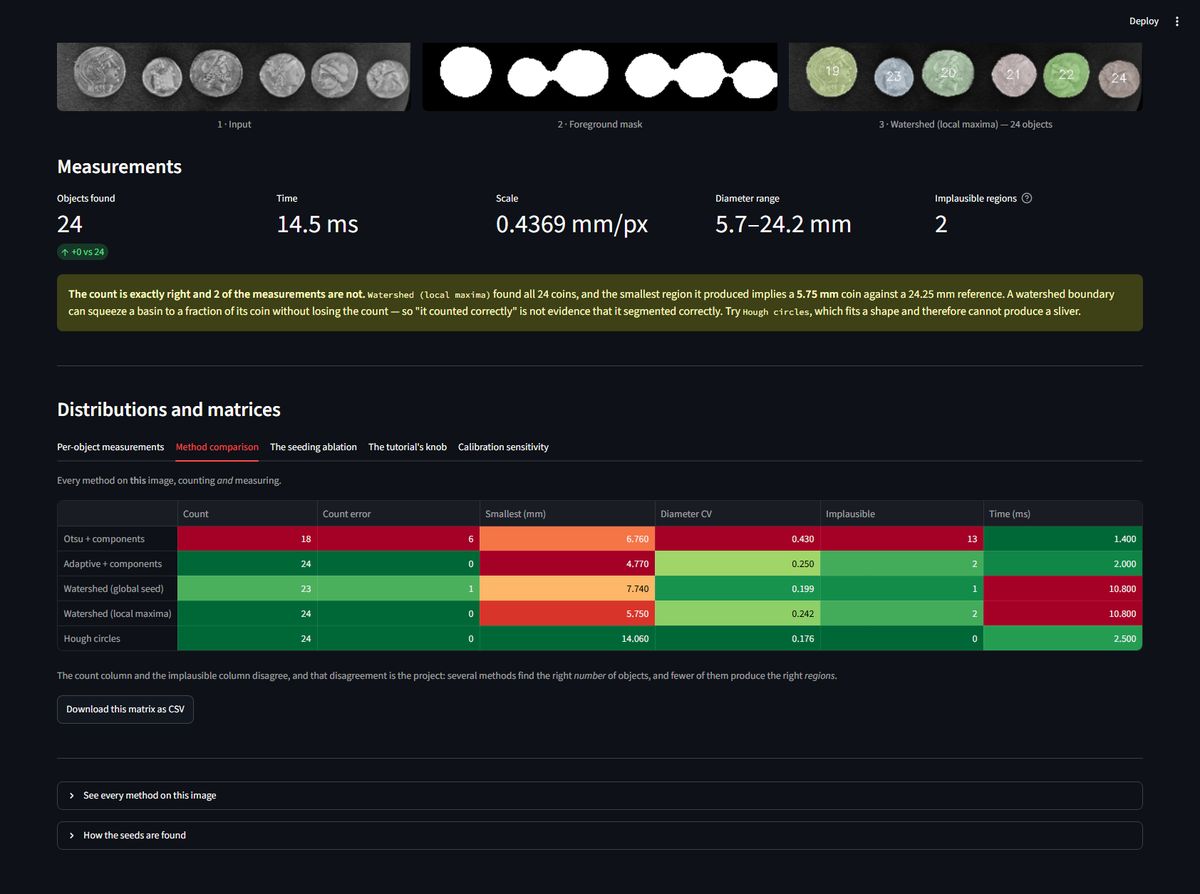
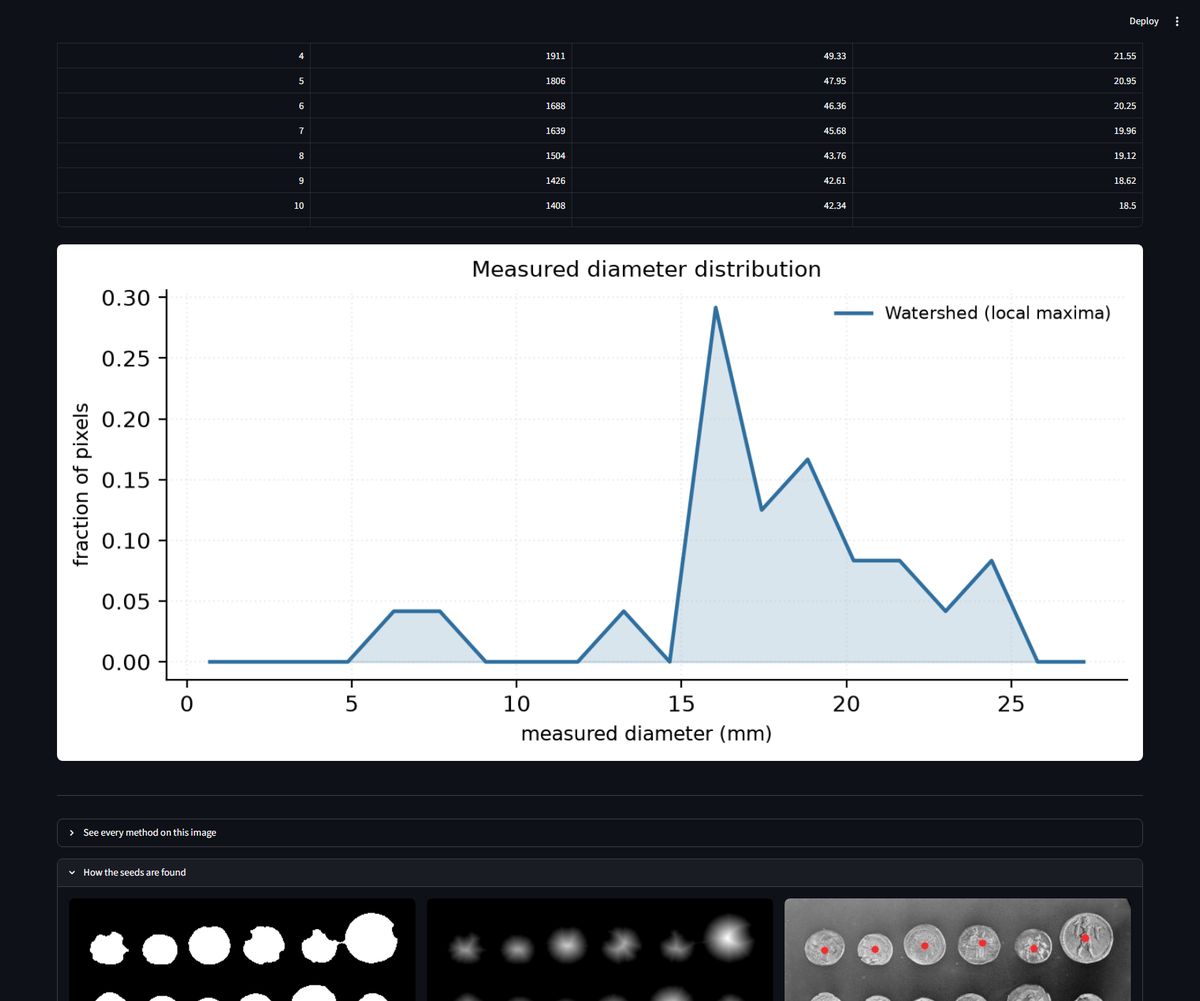 Code private Full page
Copy-move forgery
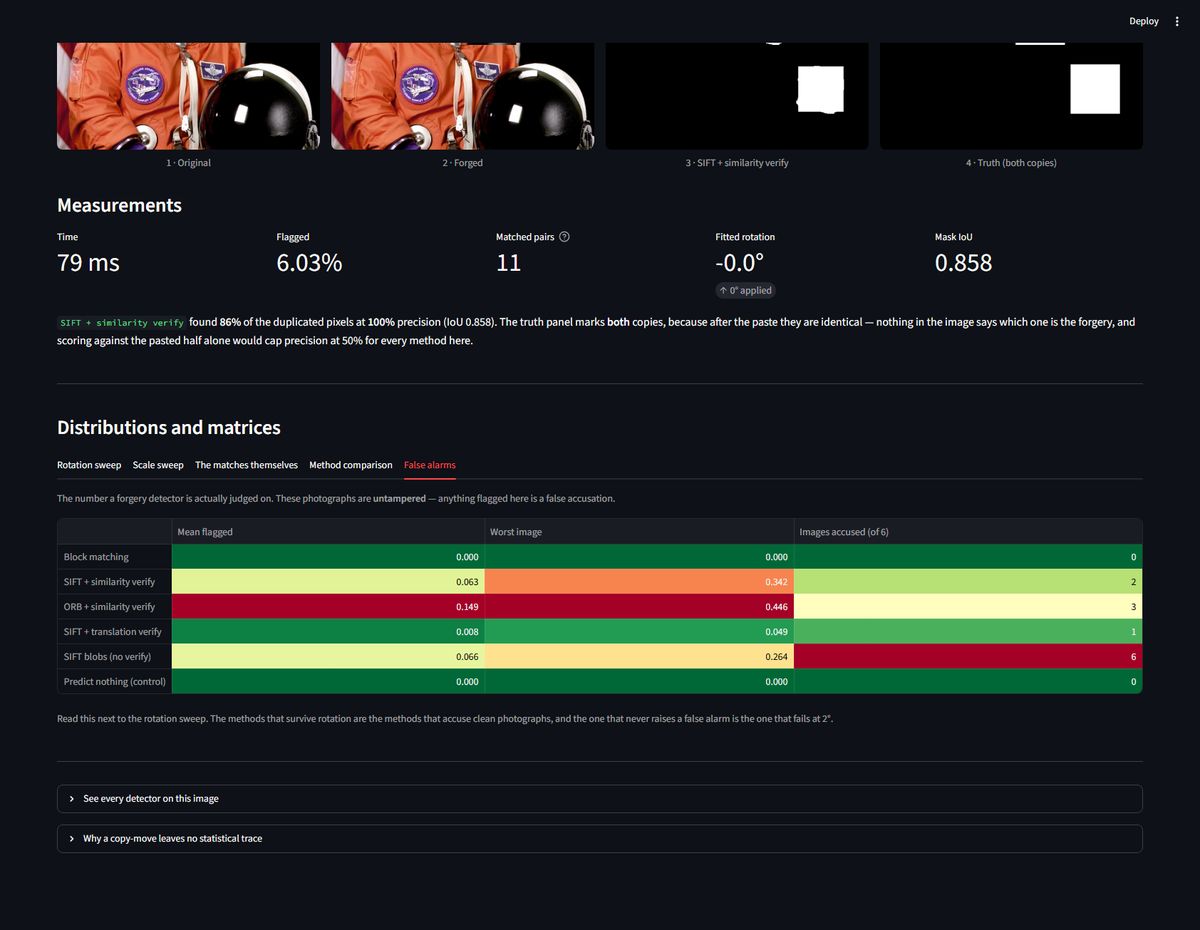
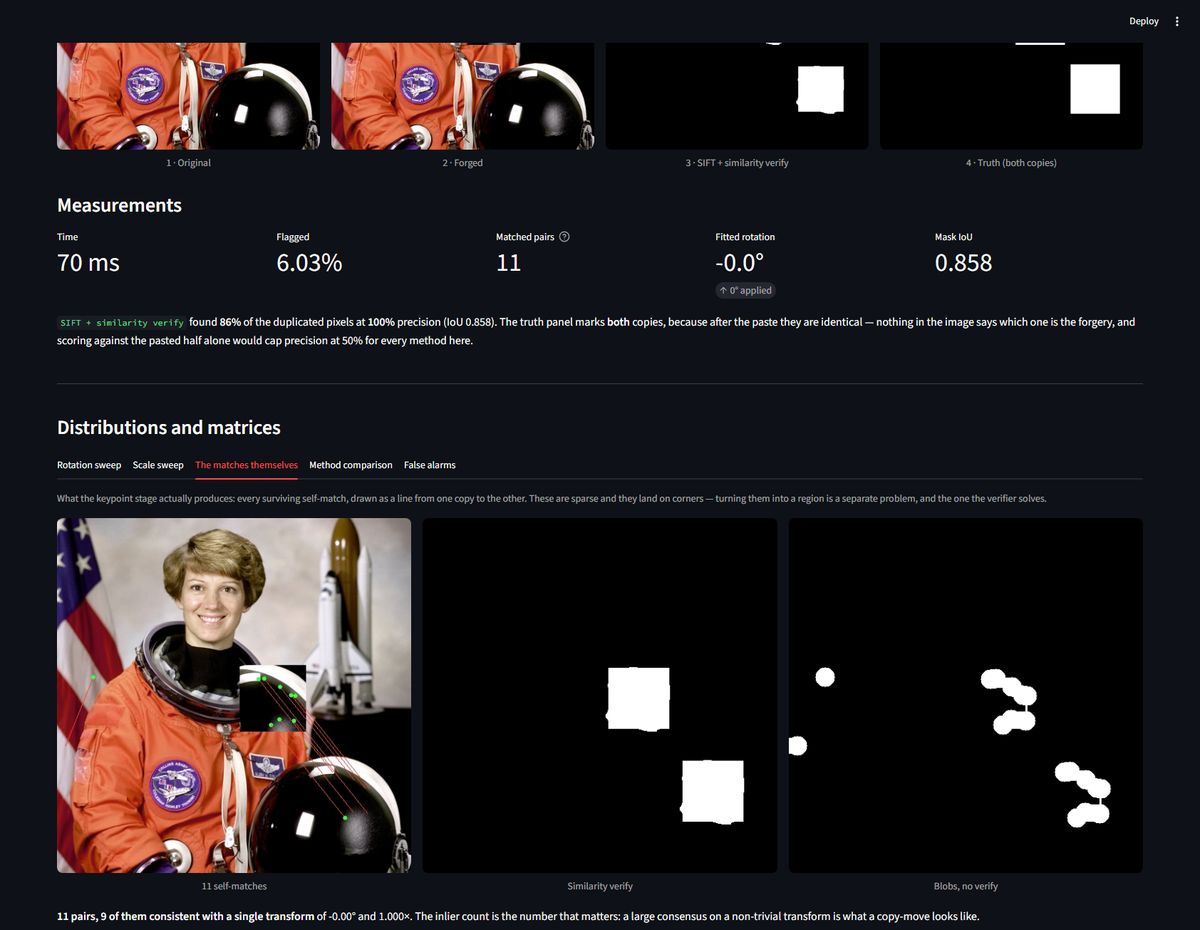
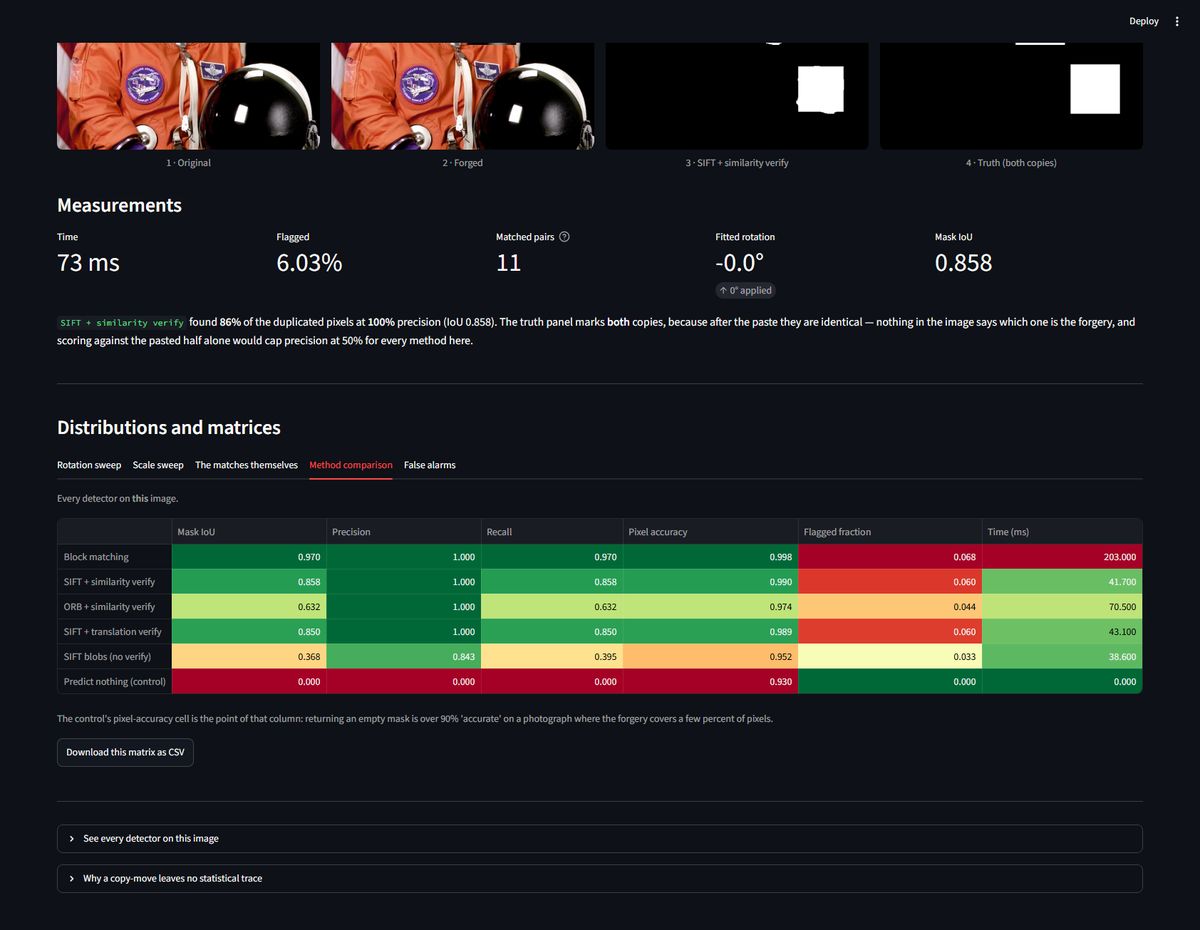
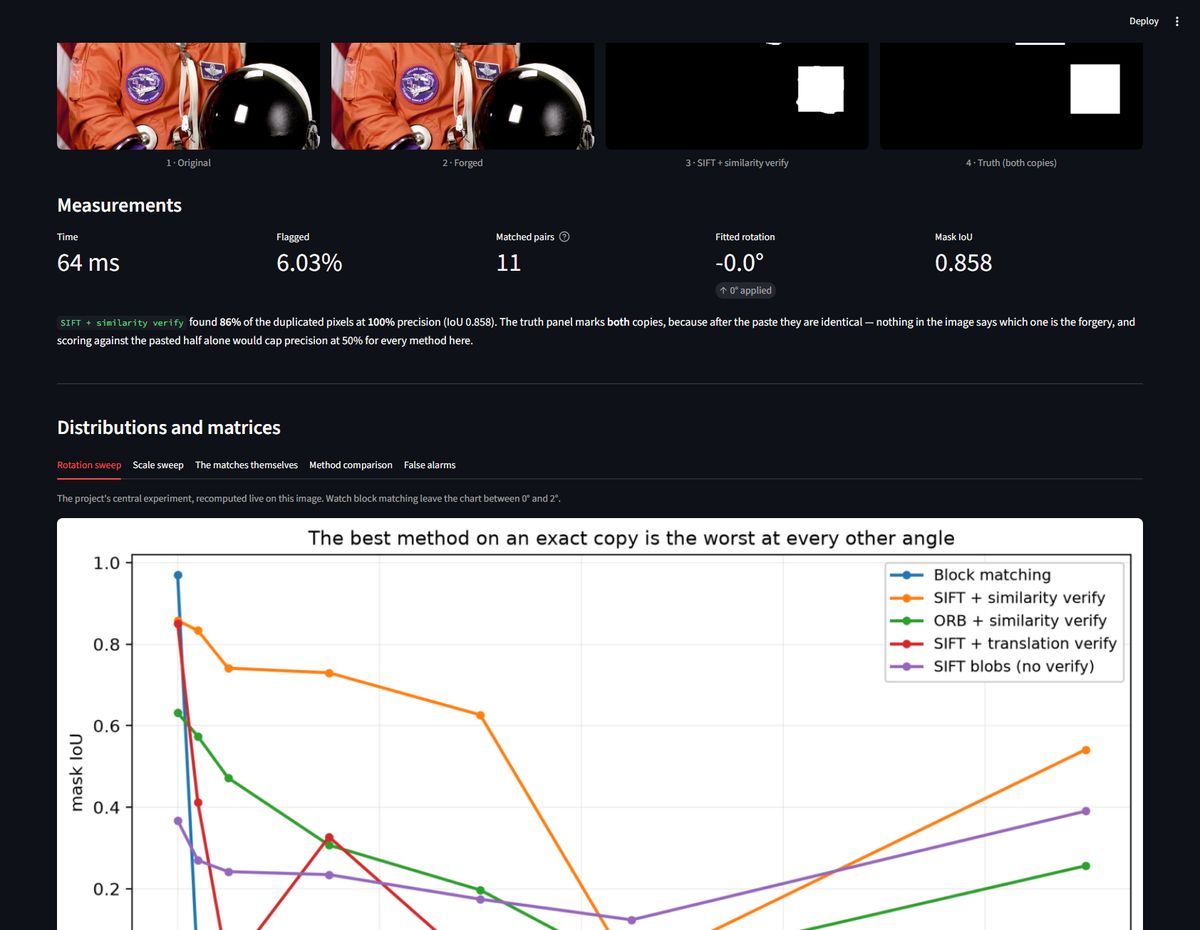
The best method on an exact copy is the worst at every other setting: block matching scores 0.9925 IoU unrotated and 0.0000 at 2°
Show the resultThe best method on an exact copy is the worst at every other setting: block matching scores 0.9925 IoU unrotated and 0.0000 at 2°. The decisive choice is the verifier's hypothesis, not the descriptor — identical SIFT matches score 0.794 vs 0.677 at 0° and 0.000 vs 0.499 at 90°. And rotation-robustness is paid for in false accusations: 6.3% of an untampered photo flagged, vs 0.0% for block matching
Sr Scene 1 penguin on pebbles · every stone resembles every stone 2 fighter jet · man-made straight edges 3 elephant herd · genuinely repeated objects 4 tortoise on rock · broken rock texture 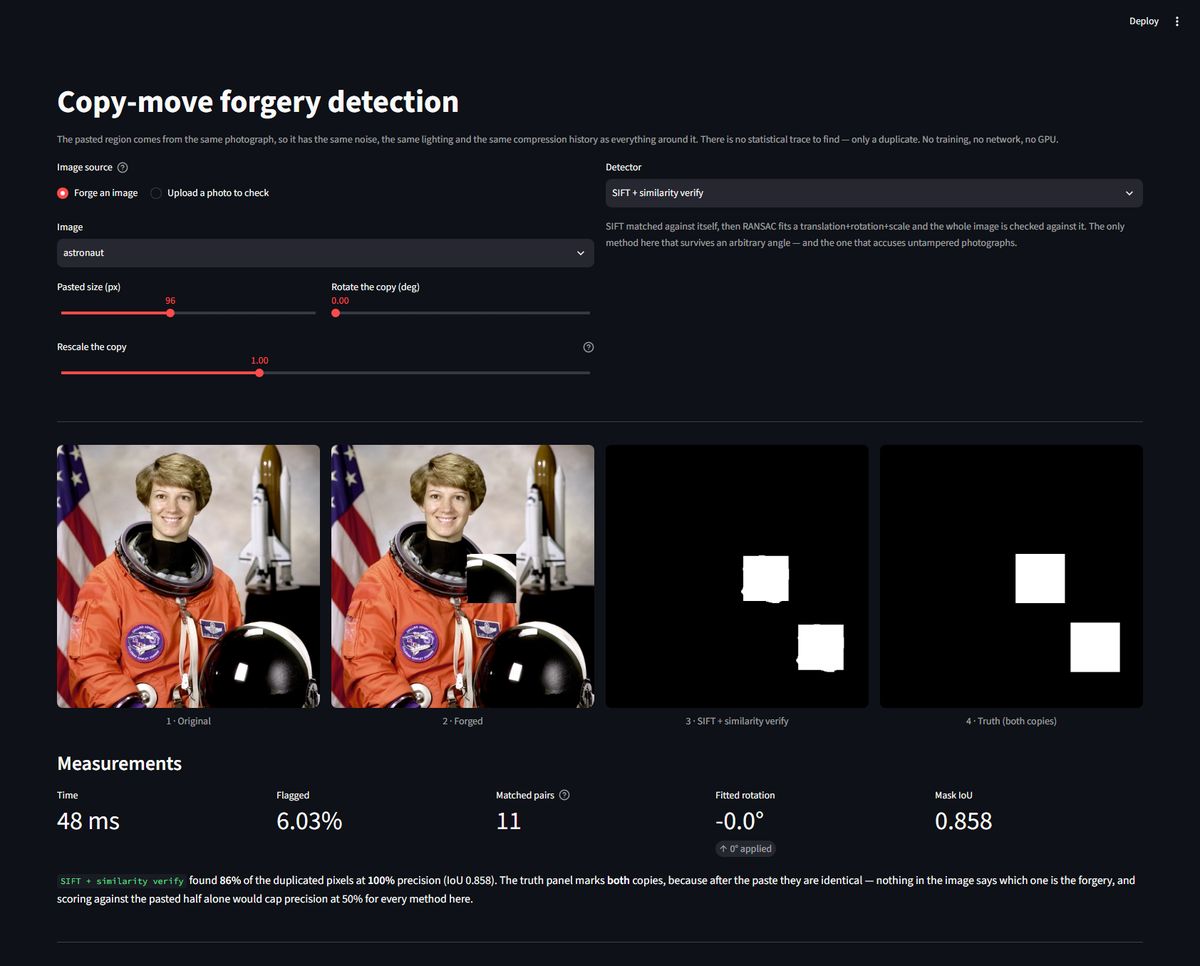
 Code private Full page
- Dehazing
Dehazing
A more accurate airlight and transmission map produce a worse image — 19.50 dB falls to 18.50 dB when the airlight error is cut from 0.063 to 0.051; the two errors cancel
Show the resultA more accurate airlight and transmission map produce a worse image — 19.50 dB falls to 18.50 dB when the airlight error is cut from 0.063 to 0.051; the two errors cancel. And CLAHE wins the contrast column (0.181 vs 0.156) while losing by 6.6 dB
Sr Scene 1 whitewater raft · people, spray, close rock 2 old street · receding to a vanishing point 3 tropical island · sky-dominant 4 motocross · near subject, shallow depth Code private Full page 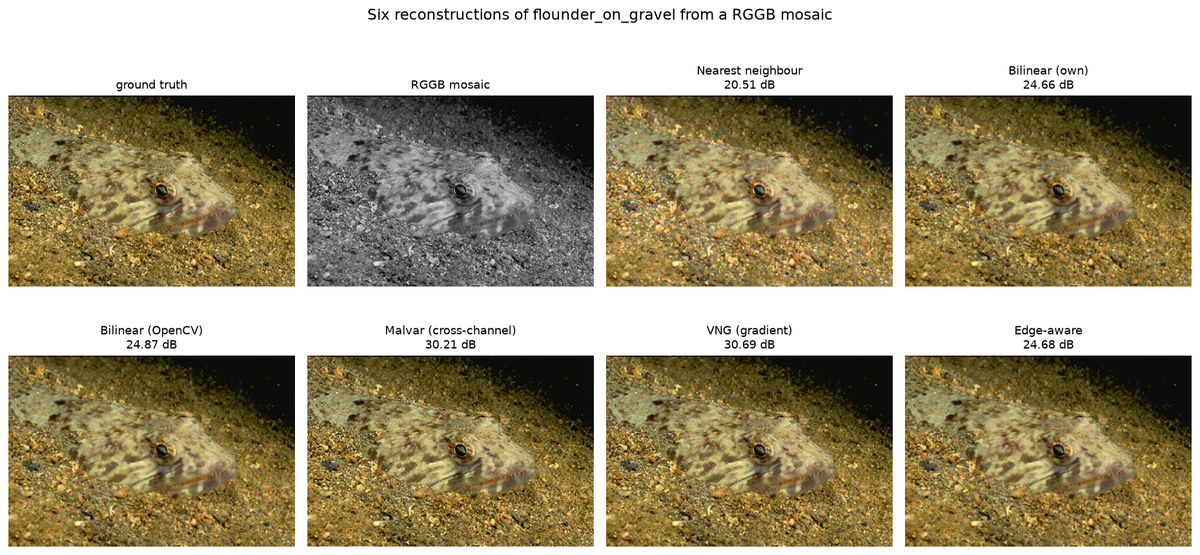
Demosaicing
The signature result: whole-image PSNR hides the failure
Show the resultEvery method, without exception. Most of a photograph is smooth, and interpolating a missing colour across a smooth region is trivial — so the whole-image average is dominated by the pixels where the problem does not exist. The failure lives on the 3% of pixels that are edges, and it is 2 to 3 dB deep there.
The colour fringing column is what a viewer actually notices: a magenta or cyan halo on a high-contrast edge, caused by red, green and blue being interpolated to slightly different places. Malvar and VNG cut it roughly in half.
---
Sr Scene 1 sea stacks · sat. edges 0.0% 2 two in headscarves · 2.6% 3 lynx on birch · 16.6% 4 flounder on gravel · 71.7% Code private Full page- Document scanner
Document scanner
Otsu's failure on shadowed pages is not because a global threshold is impossible — the best global cut scores 0.890 where Otsu scores 0.678
Show the resultOtsu's failure on shadowed pages is not because a global threshold is impossible — the best global cut scores 0.890 where Otsu scores 0.678. Also: the detector that wins on the benchmark (Otsu + contour, 1.07 px) fails on a real photograph
Sr Document 1 motion-blurred text · real 2 till receipt · generated 3 sudoku · real 4 ruled form · generated Code private Full page 
Histogram equalisation
The curve is the method
Show the resultEvery row above is one monotonic map from input level to output level. Drawing that map says more than any metric, because the oracle's curve is the correct answer and distance from it is the error:
* Global HE and histogram matching lift the shadows roughly 50 levels too far between inputs 100 and 140, then run out of range and clip. * Gamma barely has a shape — it lifts everything and is nearly flat against the oracle's slope, which is why it scores worst of all. * AHE is visibly non-monotonic. Its map depends on where the pixel is, so the median curve zig-zags; two pixels of the same input brightness come out at different levels depending on their neighbours. That is the noise amplification, drawn. * CLAHE tracks the oracle closest in the shadows and gives up at the top.
---
Sr Scene 1 moonlit pines · tone 25% 2 mare and foal · tone 76% 3 covered wagons · tone 84% 4 child on water · tone 98% Code private Full page
Keypoint detectors
Harris does not win by finding more points — but it does concentrate them
Show the resultHarris returns ~1000 keypoints and AKAZE ~357. More keypoints means more chances for one to land inside the 3 px match radius, so the natural objection is that Harris wins on density. Randomly discarding its keypoints answers it:
Flat. A tenth of the keypoints scores the same as all of them. Randomly subsampled, so the survivors are not quietly reselected for quality. Pinned by
test_harris_does_not_win_by_finding_more_keypoints.So density is not the explanation — but placement partly is. Harris's 33.5% coverage against SIFT's 80.6% says the two are not solving the same problem: Harris is answering "where are the most reliable corners", and a homography needs "where are reliable corners spread across the frame". Pinned by
test_harris_trades_frame_coverage_for_repeatability.---
Sr Scene 1 scuba diver and fish · edges 12% 2 polar bear on a rail · edges 18% 3 glass pyramid · edges 23% 4 coiled snake · edges 30% Code private Full page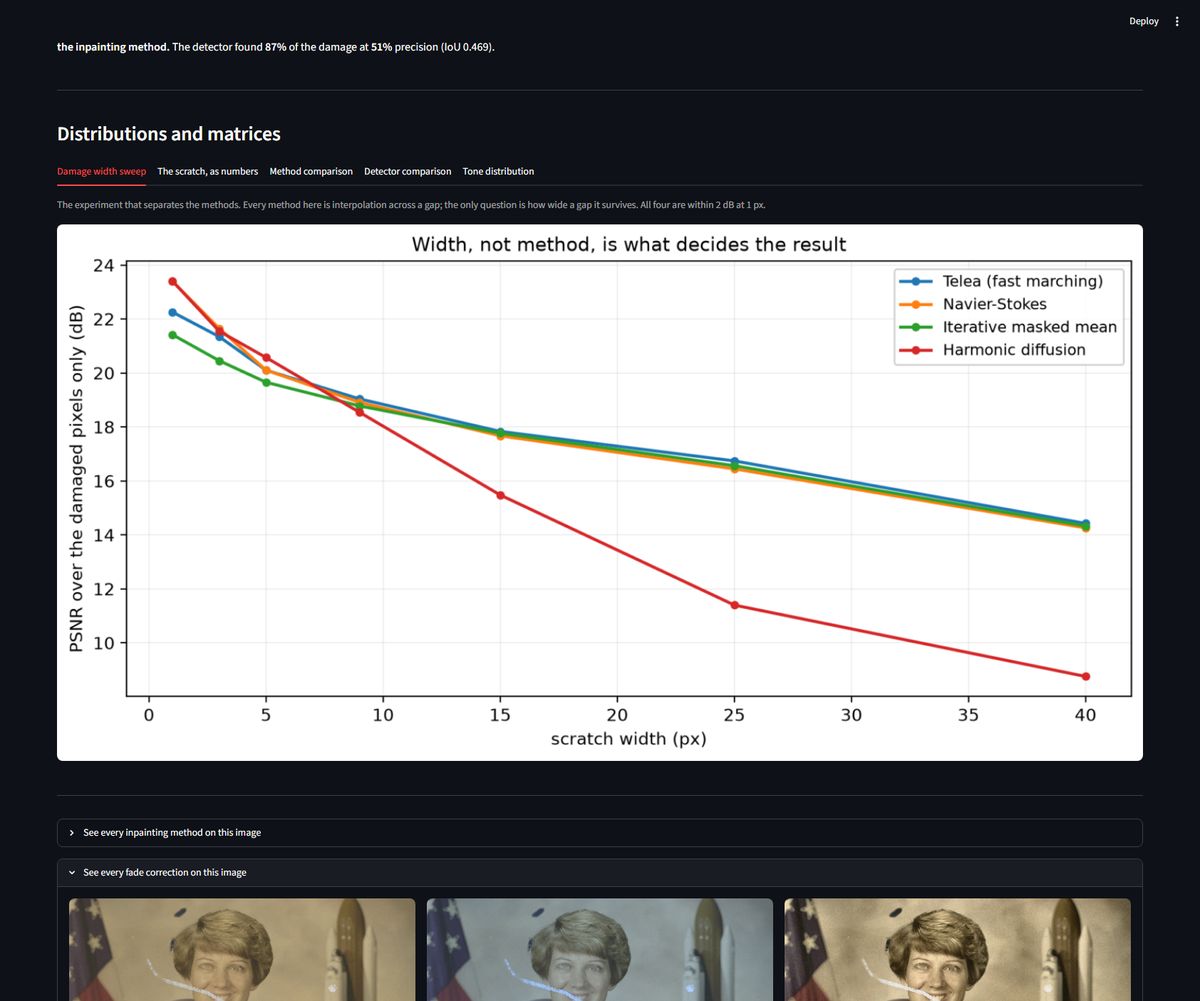
Old photo restoration
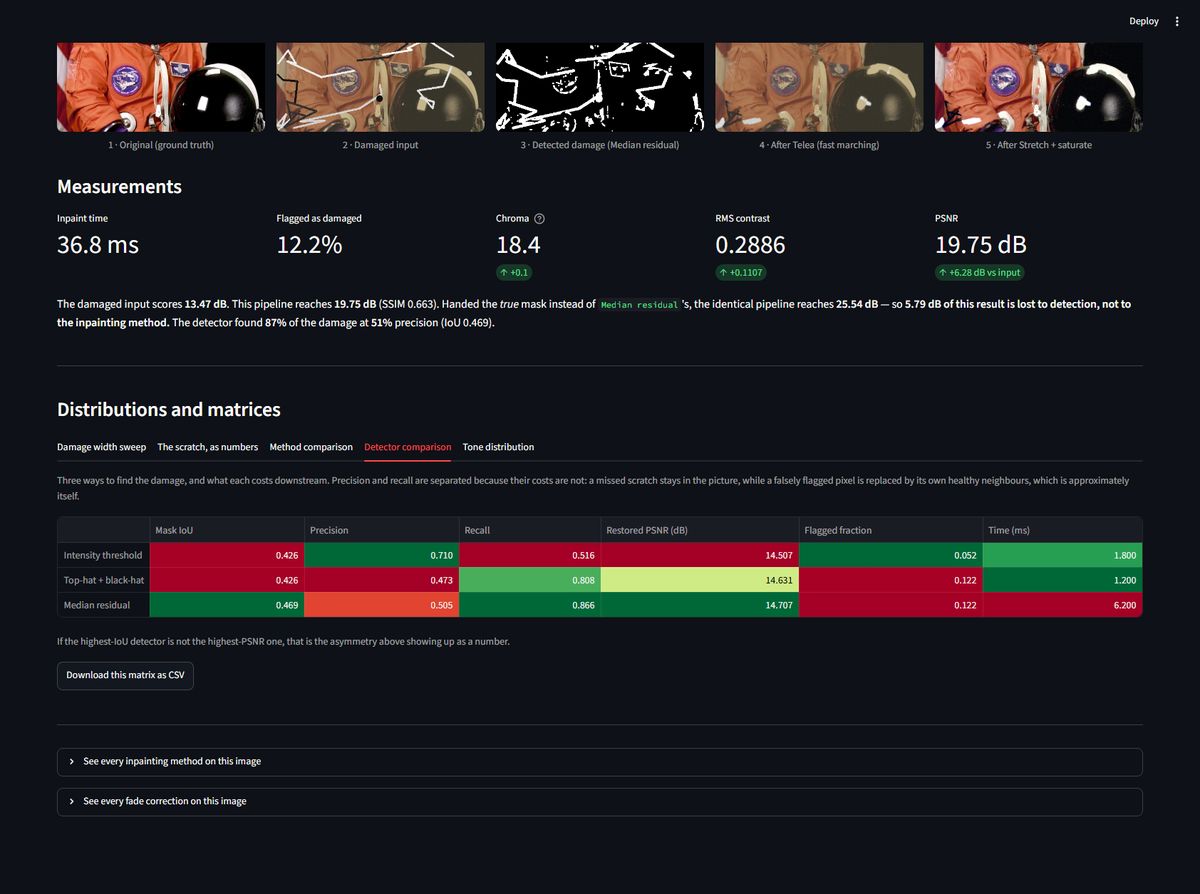
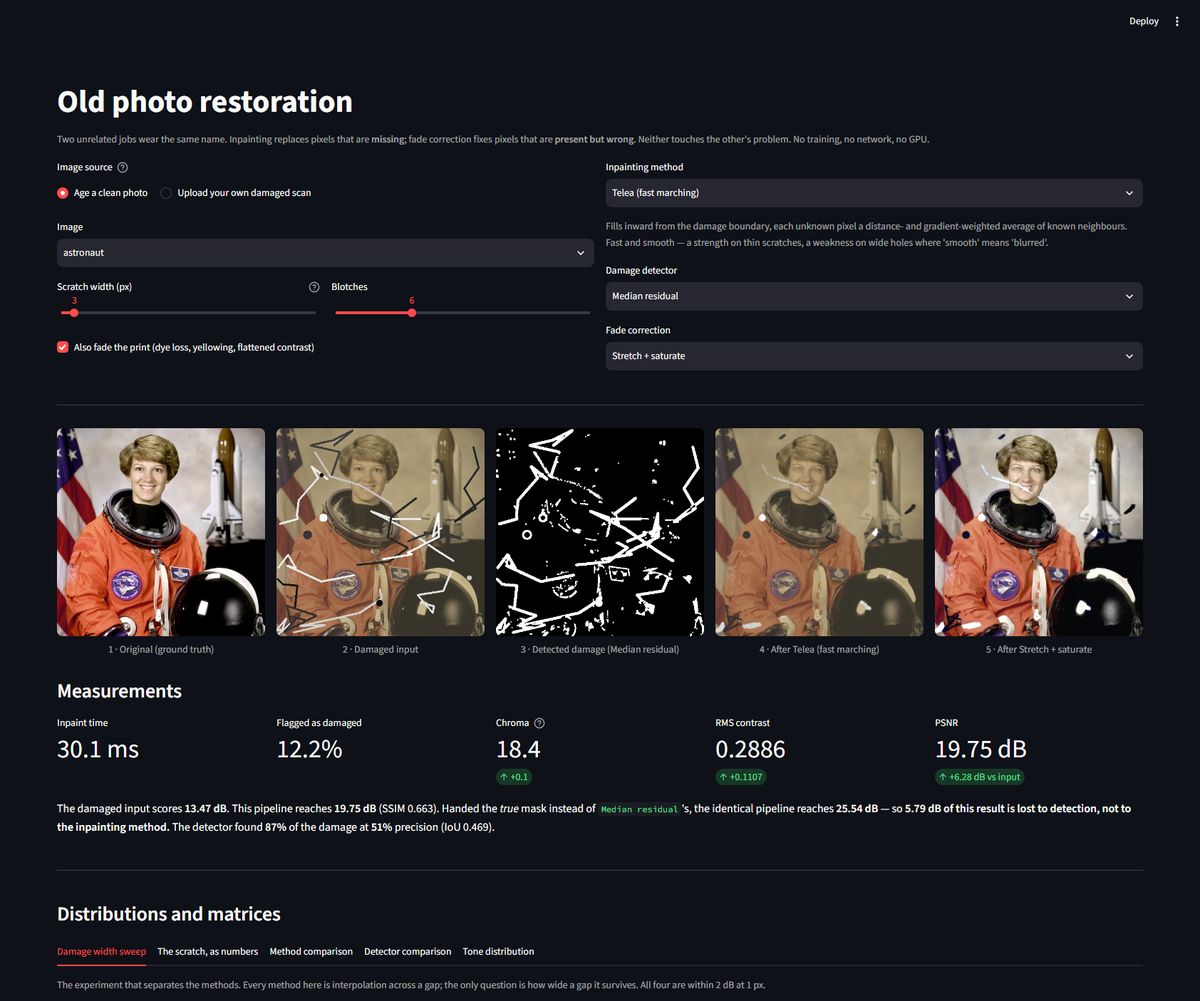
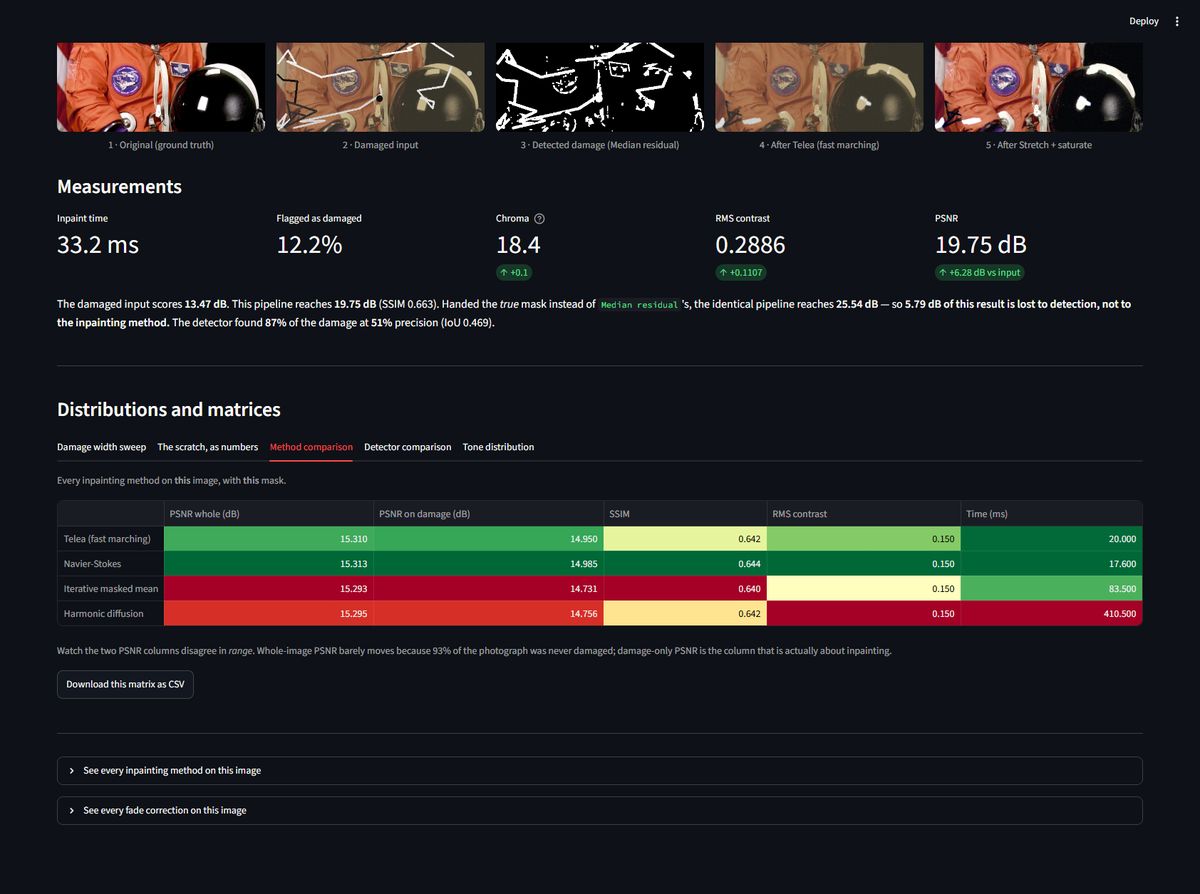
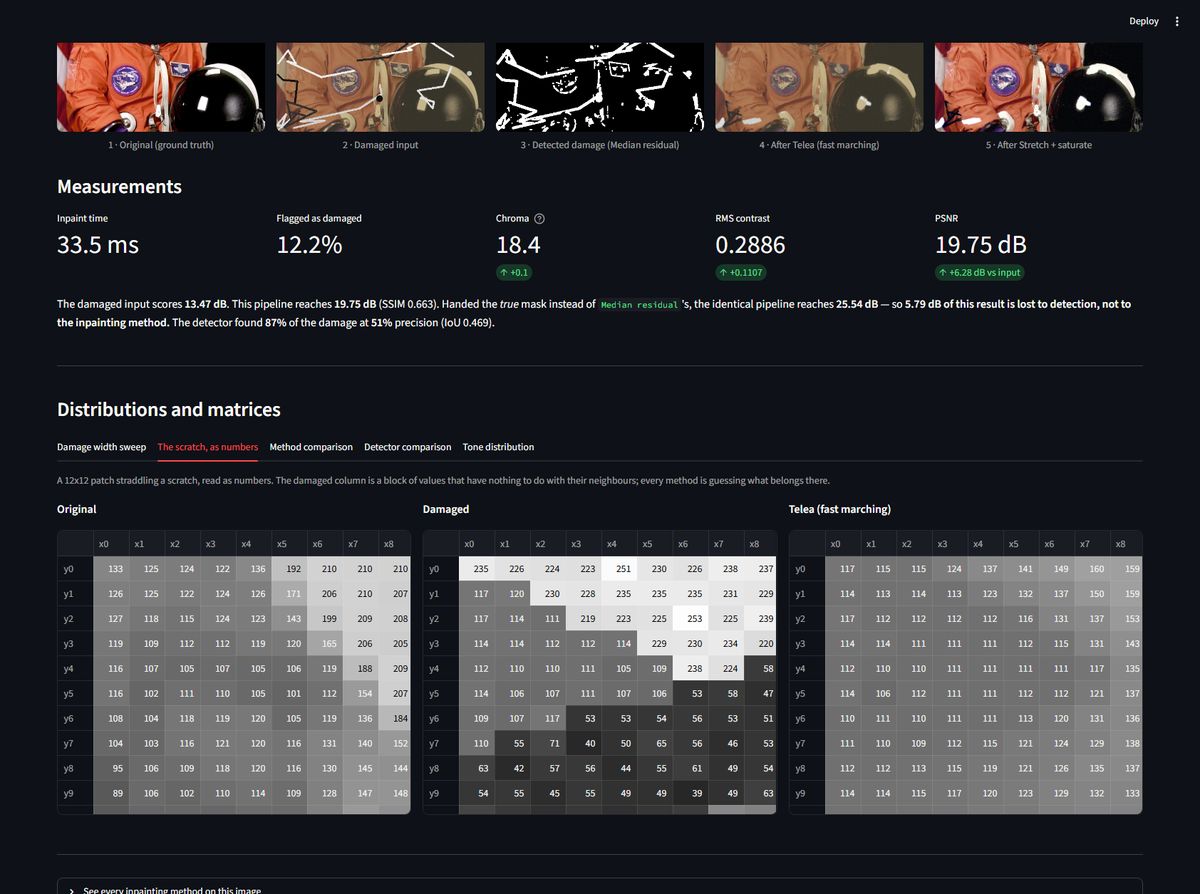
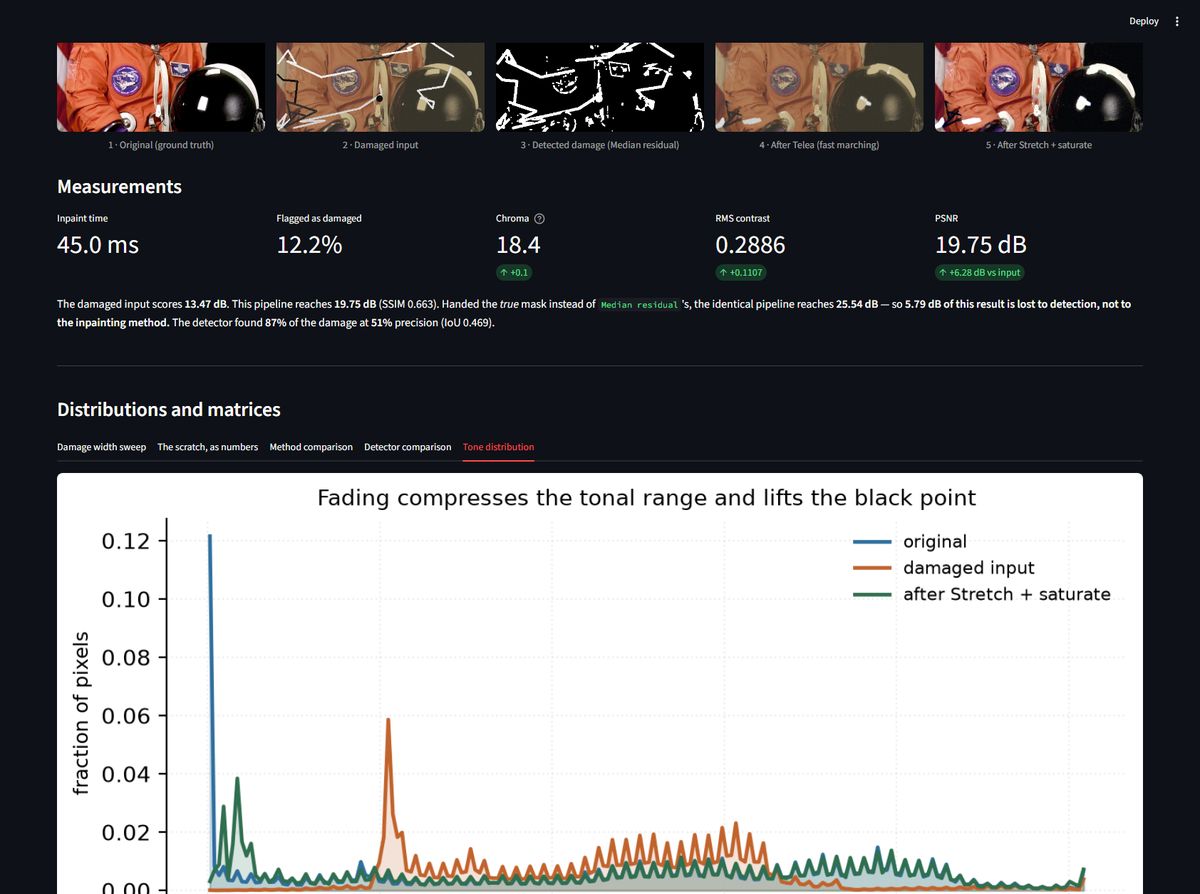
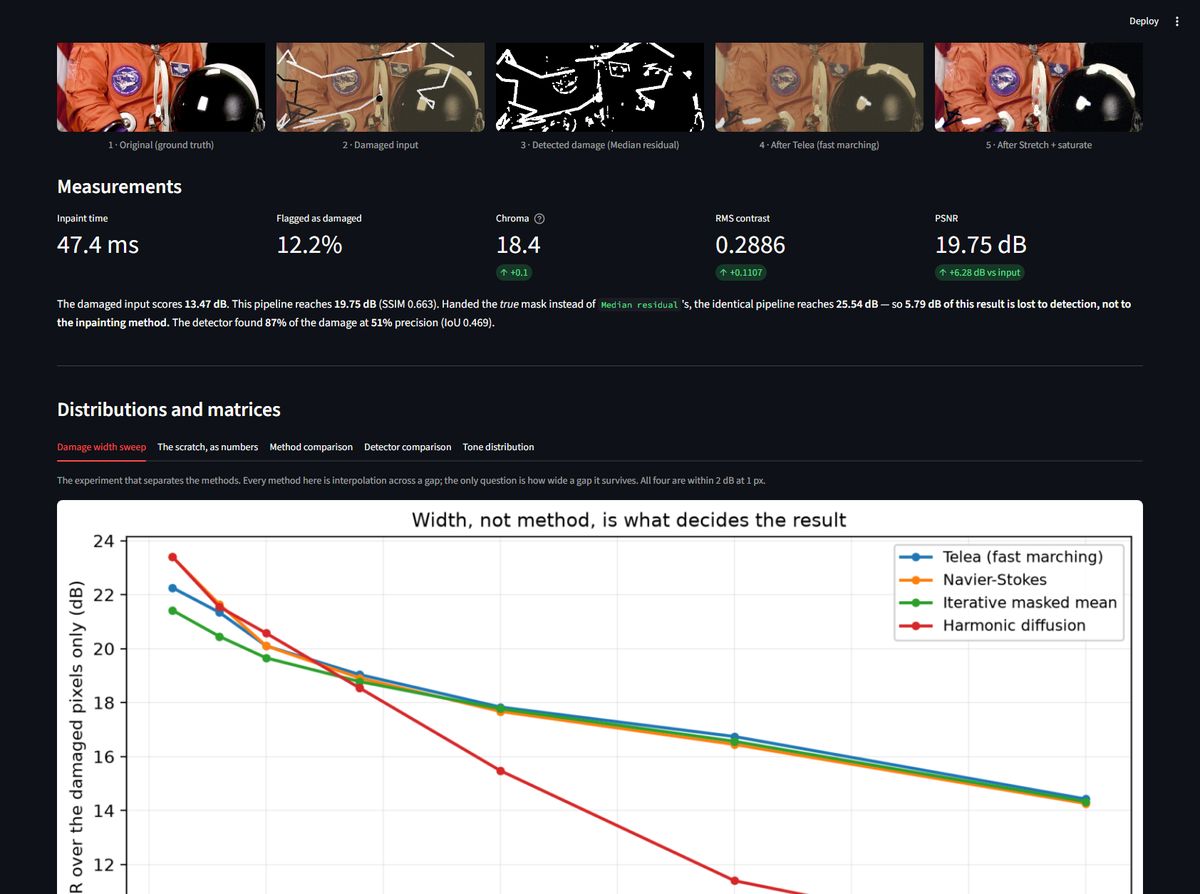
Choosing the best inpainting method is worth 1.1 dB; knowing where the damage is is worth 14.0 dB
Show the resultChoosing the best inpainting method is worth 1.1 dB; knowing where the damage is is worth 14.0 dB. Ranking detectors by IoU gets it backwards — the best-IoU detector restores to 9.88 dB, a worse-IoU one to 12.87 dB. And gray-world drives the no-reference cast to 0.04° while landing further from the truth (14.28°) than the faded input (7.72°)
Sr Photograph 1 girl in a red hat · strong red cast 2 young woman · dark background 3 man outdoors · bright sky behind 4 two men indoors · flat corridor light 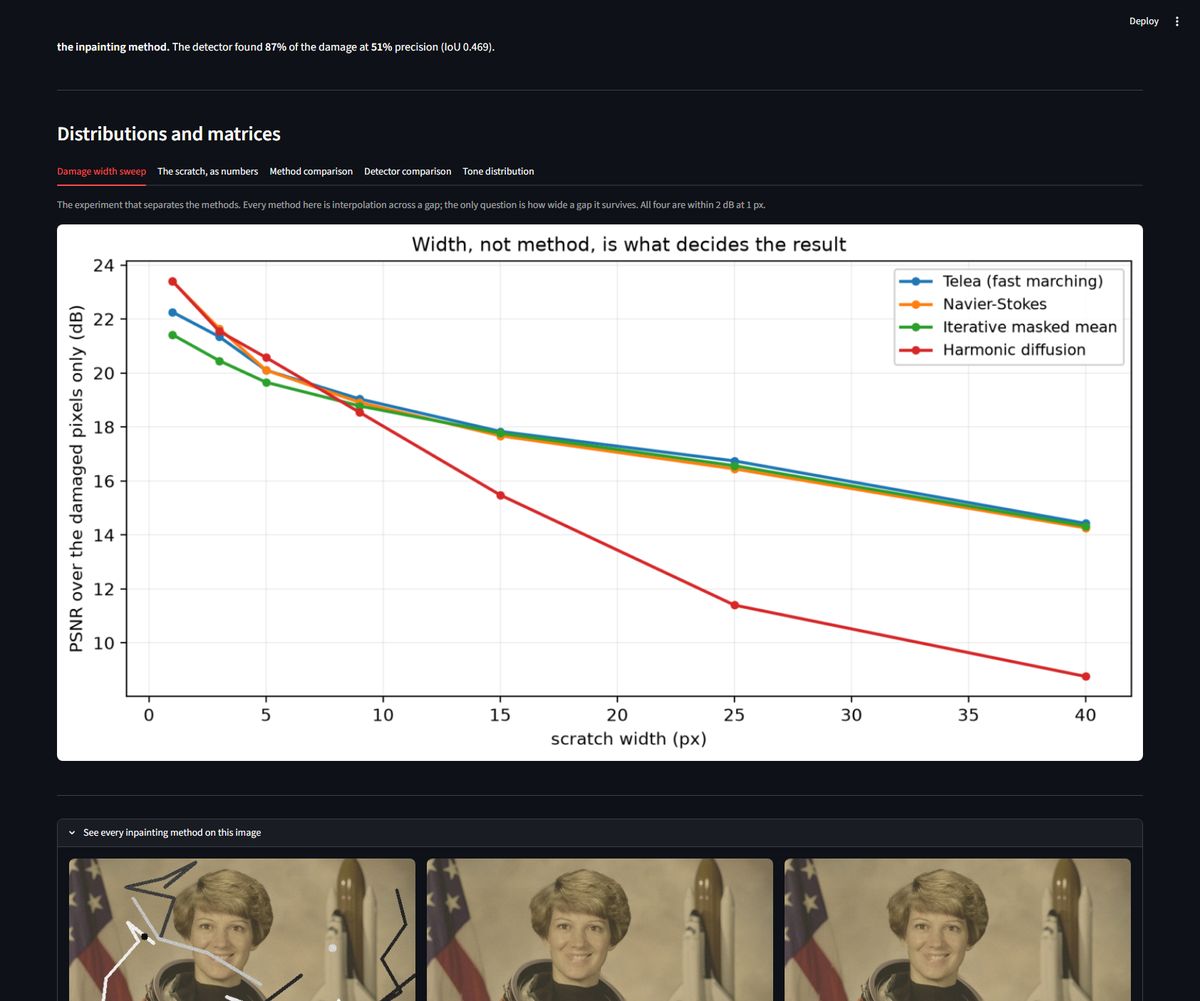
 Code private Full page

Optical flow
Where each method dies
Show the resultPlain LK's answer is 1 pixel. At 1 px it scores 0.221 against a control of 1.118 — it is working. At 2 px it scores 1.524 against 2.236, which is two thirds of the way to having found nothing, and by 4 px it is indistinguishable from the control. The textbook's "one to two pixels" is right, and the useful half of the range is the first one.
DIS does not break anywhere in this sweep. Its error at 32 px (0.238) is lower than plain LK's at 1 px. It is also faster than Farnebäck.
### Each pyramid level roughly doubles the tractable motion
The largest displacement still handled with an EPE below half the displacement:
The 2^L story holds from level 1 onward. The first level buys a factor of 4, not 2 — the coarse level halves the displacement and blurs away the fine structure the linearisation was tripping over, so it gets paid twice. A 4-level pyramid takes a method that dies at 1 px and carries it to 32.
---
Sr Scene 1 man in striped shirt · texture 61 2 bighorn on rock · texture 69 3 stone archway · texture 73 4 carved mask on thatch · texture 85 Code private Full page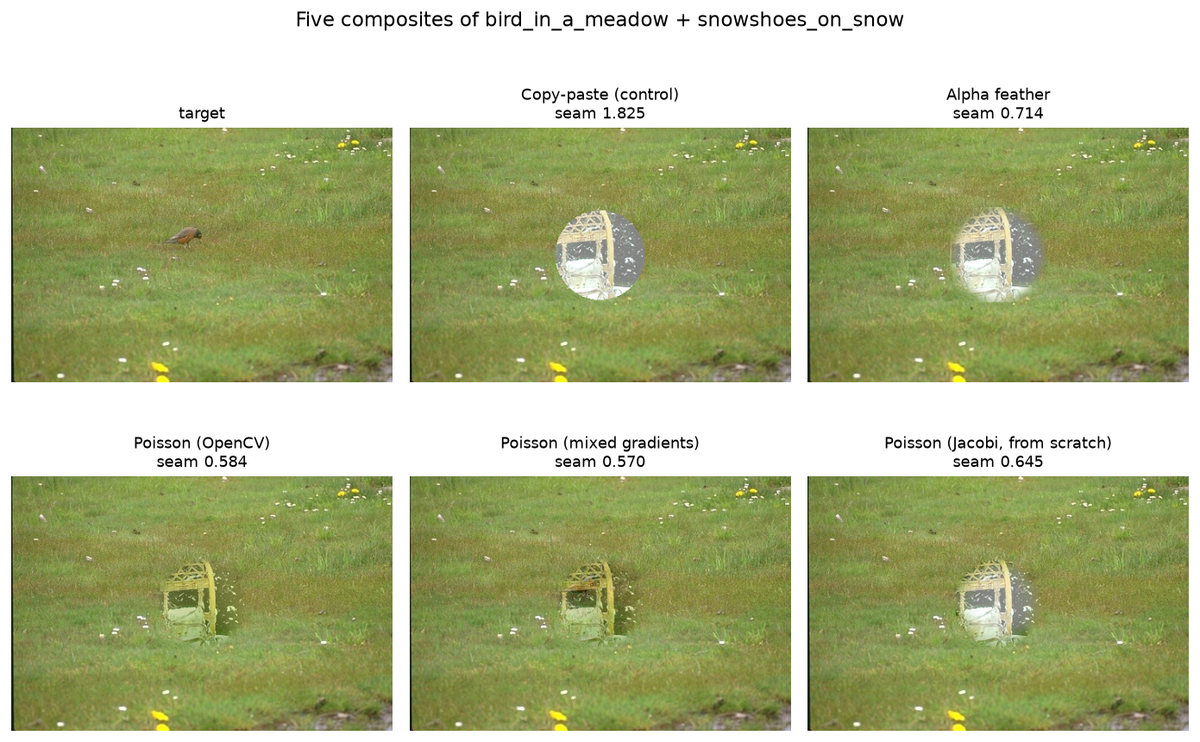
Poisson blending
The equation, solved twice
Show the result`minimise |∇f − ∇source|² inside the region subject to f = target on the boundary`whose solution satisfies
∇²f = ∇²source. Discretised, every interior pixel is the average of its four neighbours minus the source's Laplacian, so iterating that update converges to the answer.They agree to 0.0066 — two independent implementations of the same equation, which is the only real check that either is right — and the transparent one costs 38× the time.
Converged by 50 iterations and flat thereafter; the slight rise past 200 is float accumulation in the Jacobi update, not further progress.
### The one line that makes it Poisson blending
`python f = sub.copy() # target everywhere, INCLUDING the boundary ring f[interior] = patch[interior] # a starting guess, interior only`Seeding the boundary from the source instead —
f[region_mask] = patch[...]— makesf = sourcean exact fixed point of the iteration, because the solution of∇²f = ∇²gwithf = gon the boundary is g.The solver then "converged" in zero steps to the copy-paste answer and reported a seam visibility of 2.8046 — identical to the control, to four decimal places — with nothing at all to indicate it had not run. It is the quietest failure in this repository: a method that is a no-op, reporting a plausible number, in a table where another row happens to carry the same one.
---
Sr Pair 1 bird in a meadow + snowshoes on snow 2 tent on the ice + bobcat and daisies 3 wallaby in scrub + spear fisher 4 stone viaduct + skier mid air Code private Full page- Region segmentation
Region segmentation
The obvious metric ranks a grid of rectangles second
Show the resultThe natural thing to measure is IoU against a foreground mask. Doing that gives this table:
A grid of rectangles that has never looked at the image scores 0.914 and beats five of the six real methods. It beats mean-shift, the best method by boundary F, by 0.54.
Two things conspire to produce that.
The region-to-foreground conversion uses the truth.
labels_to_foregroundassigns each region to foreground or background by which it overlaps more. That is deliberately generous — so a low score cannot be blamed on the conversion — and the consequence is that the more regions a method returns, the more the oracle assignment can do for it. At one region per pixel the score is 1.0 for any method whatsoever.And the binary target was wrong in the first place. A human segmentation is a labelling, not a figure/ground split.
dominant_foregroundtakes the largest annotated region to be the background and inverts it, which fails whenever that is not true: onmemorial_archthe largest region covers 24.5% of the frame, so the "foreground" is 75.5% of the picture and corresponds to nothing anyone drew. Methods returning sensible regions score 0.000 against it.Boundary F is the metric BSDS was built for and the one every published number on it uses. It does not reward region count, and under it the grid sits last. Pinned by
test_a_grid_of_rectangles_beats_most_real_methods_on_iouandtest_boundary_recall_separates_what_iou_cannot.---
Method Boundary F Another human (ceiling) 0.904 Mean-shift 0.4331 Region growing 0.4051 Watershed + markers 0.3512 GrabCut (seeded) 0.3358 SLIC superpixels 0.3115 Watershed (no markers) 0.2190 Grid tiles (control) 0.1663 Code private Full page 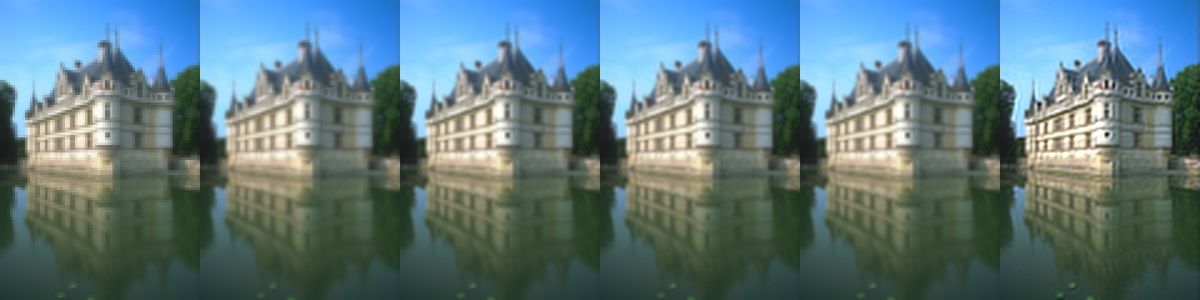
Super resolution, classical
One scanline says it better than the table
Show the resultThe truth (dashed) swings between 36 and 243 across four pixels. Every method draws a smooth line through the middle of it. Nearest visibly steps and the rest ramp — that difference is the 0.49 dB — but next to the original they are the same curve.
---
Sr Scene 1 hawk in scrub · high-freq 39.0% 2 rider and herd · high-freq 48.1% 3 longtail boats · high-freq 54.7% 4 parasols and willows · high-freq 60.0% Code private Full page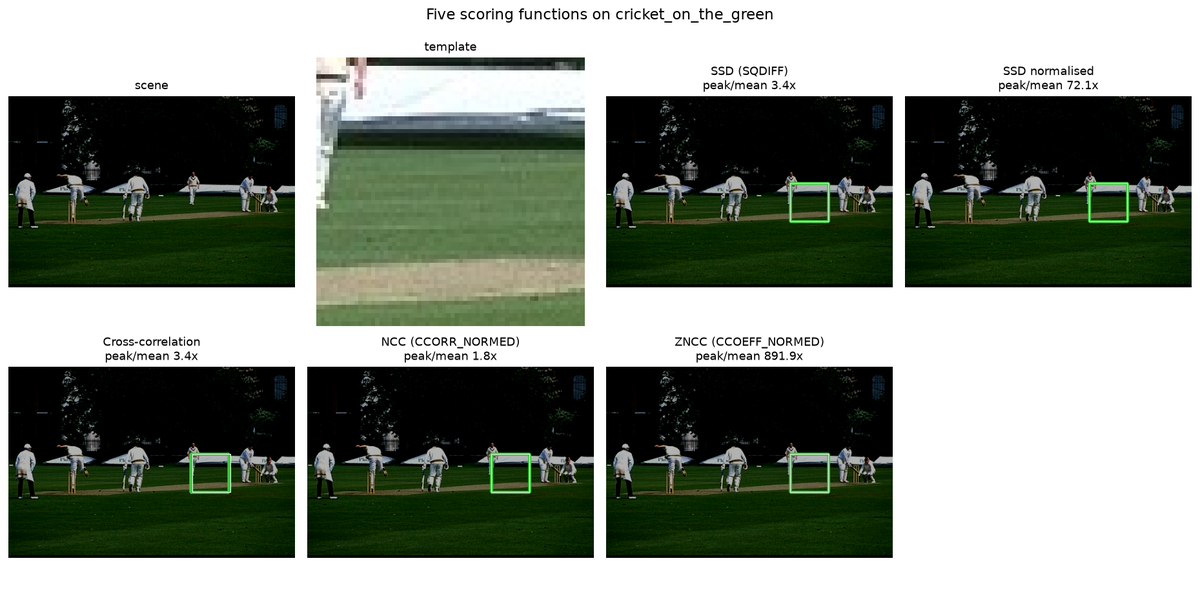
Template matching
The invariances, and the sign that reveals them
Show the resultAt a tenth of the brightness NCC still localises every template and SSD normalised localises none. Dividing by the standard deviation is exactly a scale invariance, and the sweep has to reach 10× before the claim is visible at all — at the usual gentle 0.9 every method still works.
> ZNCC holds 1.000 at every negative offset; NCC falls to 0.458. Subtracting > the mean is exactly an offset invariance, and NCC does not subtract the mean. > > It takes a negative offset to show it. Brightening clips at white and > destroys the structure for everyone — at +0.4 NCC and ZNCC both sit at 0.958 > and the difference between them is invisible. Darkening clips only in the > shadows, which leaves enough for a mean-subtracting method and not enough for > anything else. A sweep over positive offsets alone would have reported that > NCC and ZNCC are equivalent.
The algebra says the same thing with no image search involved. ZNCC of a patch against
a·patch + bis 1.0 for any positiveaand anyb:---
Sr Scene 1 hippo in green water · entropy 5.3 2 elephants and grooms · entropy 7.4 3 two at a railing · entropy 7.6 4 monks at a noticeboard · entropy 7.9 Code private Full page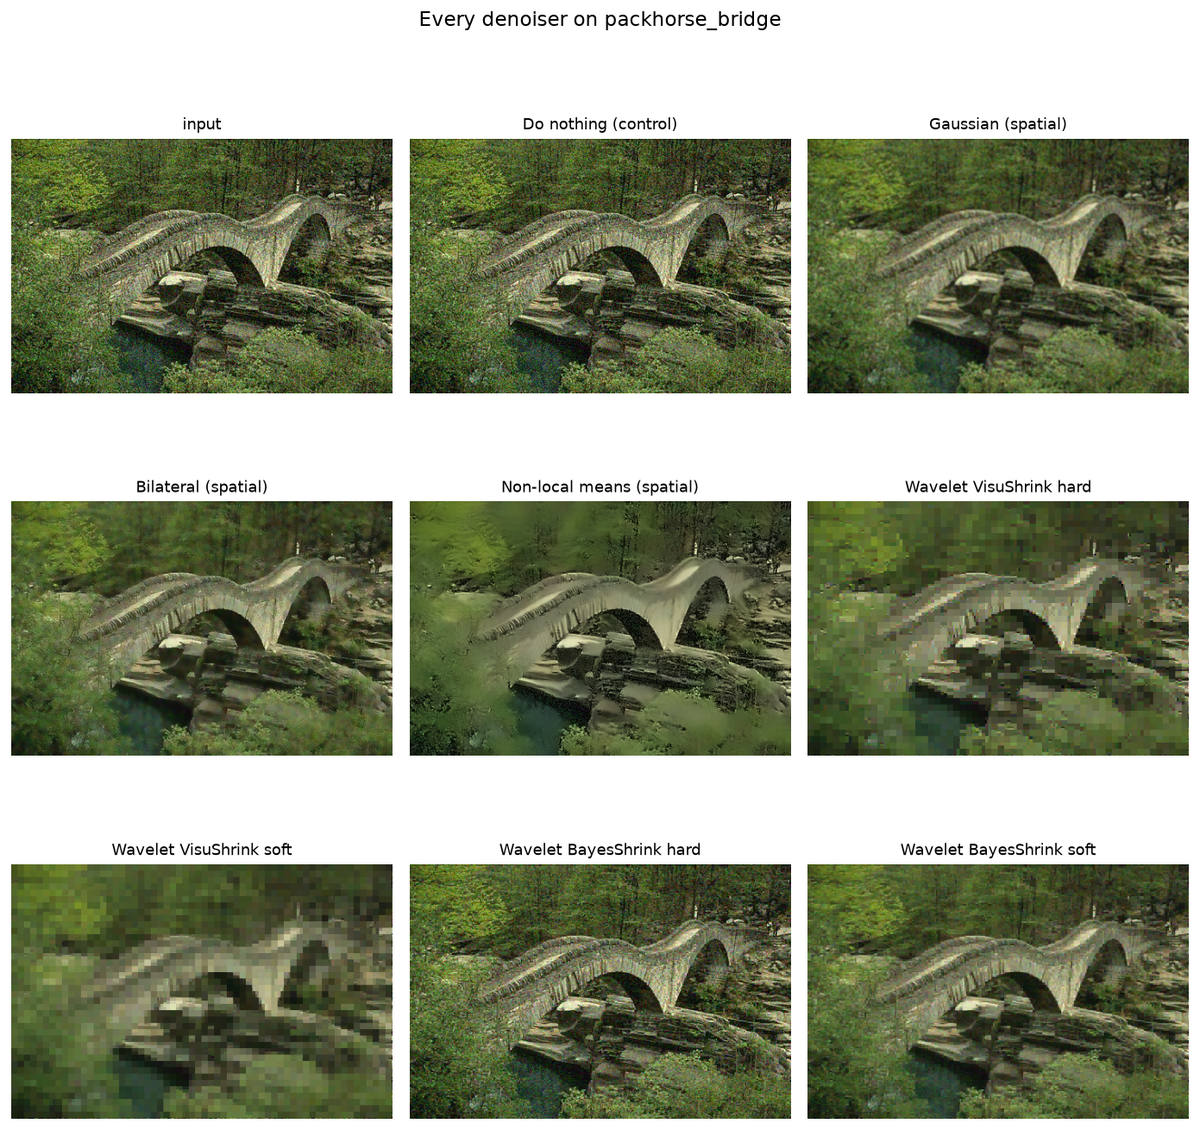
Wavelet denoising
The premise, measured before anything depends on it
Show the resultThe gap is real and large. A perfectly flat spectrum would put 0.10 in the top 10%; noise scores 0.44 because the largest samples of a Gaussian are still larger than the rest, and every photograph scores 0.69 or above. Thresholding really can separate them.
That is what makes the result interesting rather than disappointing: the method's justification is sound, and the Haar basis is still not a good enough one.
---
Sr Scene 1 black panther · sparsity 0.788 2 warthogs drinking · sparsity 0.855 3 cormorants nesting · sparsity 0.921 4 taj mahal reflected · sparsity 0.947 Code private Full page